


PT Indocement (IDX: INTP)
Low cost producer for 25-30% of estimated replacement cost

The purpose of this blog is to share my research with a wider community, in hopes of receiving constructive feedback and bringing greater awareness to what I believe are attractive investment opportunities. I appreciate any and all constructive feedback and pushback on my posts and ideas. I usually own shares, at the time of writing, of companies discussed on this blog. To review my investment philosophy and the structure for each post see my introductory post here: Patches AKF Intro. Nothing I write should be considered investment advice. Please share and invite others to subscribe if you find these posts valuable. I post updates and thoughts more regularly on X (Twitter) at @PatchesAKF
January 30, 2025

Summary (I kept this post shorter than my recent ones!): Indocement is the second largest cement producer in Indonesia with ~25% market share, but it has ~37% market share on Java and nearly 50% market share on Java excluding East Java. INTP is the low cost producer/supplier of cement on Java. Heidelberg Materials has owned more than 50% of INTP since 2001. Indonesia’s cement industry saw dramatic growth in capacity from 2012 to 2018 that caused industry utilization to fall from the mid-80% range to the mid-50% range in 2024. Low utilization led to lower prices and significant financial issues for most new entrants over the last several years. Despite the industry situation, INTP has averaged a ~19% EBITDA margin and a ~9% ROIC since 2017 (compared to 34% and 33%, respectively, over the prior decade). The company has been conservatively managed since Heidelberg gained control, maintaining a net cash position for the last 16 years. INTP has historically returned ~100% of free cash flow to shareholders through a dividend, but it also began repurchasing shares in 2021. Total shares have fallen ~9% over the last three years (including -2.4% in 2024). Share repurchases were paused in 2023 when INTP acquired Semen Grobogan, whose assets are in Central Java. The acquisition was countercyclical and strategic, and the price paid was attractive for a recently built cement plant.
The current share price values Indocement’s integrated capacity for less than $42/ton (ex-leased capacity). This is significantly below a conservative estimate of the replacement cost of this capacity of $150/ton. Private market transactions for cement assets with strong competitive positions regularly exceed $200/ton. Admittedly, there is no telling when the gap between INTP’s share price and intrinsic value will close. The prospective IRRs for a 5, 7, and 10-year investment (assuming the IV is equal to replacement cost) excluding capital returned to shareholders are 29%, 20%, and 13%. Management has returned 100% of the free cash flow to shareholders over the last decade through dividends (primarily) and share repurchases (lately). If this trend of returning 100% of capital to shareholders does continue (without an improvement in FCF from the LTM), the IRRs for the time frames mentioned above are 33%, 24%, and 18%.
So, what are the big risks?
Currency depreciation. However, cement prices and cement asset values tend to track the USD over the long-term due to the significant use of energy in production (typically priced in USD).
Government action that is adverse to foreign owners and minority shareholders.
Capital allocation deviates from the historical record and INTP begins acquiring non-strategic assets at high valuations. Given Heidelberg’s control, I think this is unlikely.
The valuation can always get more extreme, although this isn’t a real risk for those with a long-term perspective.
Company Overview: PT Indocement Tunggal Prakarsa (Indocement or INTP) was officially created in 1985 through the combination of six cement companies that were all owned and controlled by the Salim Group. Expansion into the cement industry by the Salim Group was at the behest of Indonesia’s long-time president Muhammad Suharto. Combing the six cement companies was part of a government capital injection (some refer to it as a bailout) during the oil crisis of the mid-1980’s. Indonesia’s government received 35% of Indocement’s equity in exchange for the capital. Indocement held an IPO in 1989, and Heidelberg Materials acquired majority control in 2001. The government no longer owns a stake, while Heidelberg owns ~56%. Indocement has 14 integrated cement plants with a total annual production capacity of 28.2m tons. Twelve of the plants are in West Java, one is in Central Java, and one is in South Kalimantan. Additionally, INTP signed a 3-year lease agreement in 2022 for a cement plant in Sulawesi that is owned by Semen Bosowa (SBM) and has 3.5m tons of integrated capacity. The map below shows Indocement’s key assets.

While there are three reported segments – cement, ready-mix concrete (RMC), and aggregates – only two are external businesses: cement (~92% of external sales) and RMC (~8%). Aggregates primarily support the RMC business. Cement accounts for 97% of operating income.
Industry + Business Model: The barriers to entry for cement production in emerging markets are medium-low. Environmental regulations are less stringent compared to developed countries, but building an integrated cement plant costs ~$150 per ton of annual capacity and is location constrained. Cement is heavy, bulky and cheap. The cost of transporting cement long distances by road usually makes it an unprofitable venture – especially in a country like Indonesia where the infrastructure is underdeveloped. Cement rarely travels more than 200m (320km) by road, but it can be transported moderate distances by rail and longer distances by water. (This latter point is an important note considering Indonesia is an archipelago.) Consequently, plants must be located somewhat close to both a limestone quarry and the end markets. There are production-based economies of scale, given high fixed costs and moderate marginal production costs, and high local market share can lead to distribution advantages. These both favor incumbents over new entrants. Barriers to exit are high; capacity can be mothballed for a time, but it usually doesn’t make sense to decommission an integrated plant.
This combination of factors leads to long capacity-driven cycles in emerging markets. Periods of tight supply incentivize significant new capacity all at once, typically outpacing demand growth, which drives down industry utilization, prices, and profitability. Downcycles can last years, with a correction in the supply-demand equilibrium largely dependent on growth in demand. Leading players can remain profitable throughout the cycle and typically drive consolidation. Accordingly, markets tend to be dominated by a few players who collect most of the returns throughout a cycle. Semen Indonesia, the largest cement company in Indonesia, and Indocement, the second largest, account for over >65% of cement capacity in Indonesia. This is shown in the image below from early 2022 (the only meaningful change since then is INTP’s acquisition of Grobogan in late 2023). These two account for an even greater percentage of volume – Semen Indonesia had ~52% volume market share in 2023 and Indocement had ~30% (proforma for Grobogan). Indocement’s EBITDA margin and ROIC bottomed out at 15% and 5%, respectively, in 2017. These metrics have averaged 19% and 9%, respectively, during the current downcycle (with INTP’s capacity utilization averaging 67%).

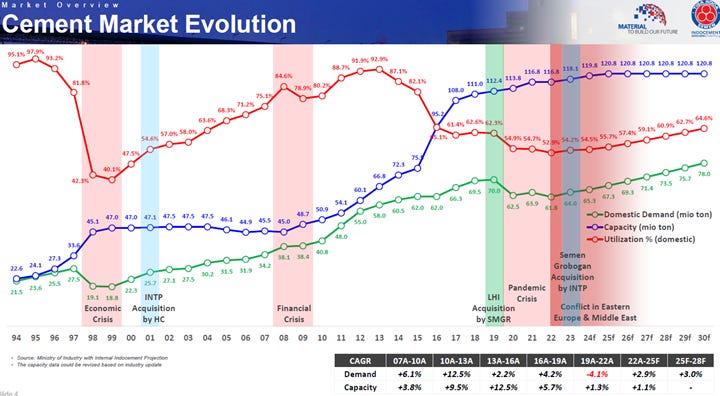
Industry Capacity: The decade following the Asian financial crisis for the Indonesian cement industry was characterized by excess capacity. Domestic capacity utilization was ~60% for most of this period. Growth in cement consumption picked up around 2007, supported by the commodity boom, and averaged ~8.5% per annum through 2014. After years of excess capacity, the industry was not prepared to support this rapid growth and capacity utilization averaged ~90% from 2011 to 2014. High utilization led to constant price increases and 20-30% operating margins for industry leaders. This incentivized heavy investment by both incumbents and new entrants, and domestic capacity grew ~130% from 2010 to 2023. Capacity increased by ~50m tons from 2012 to 2018, nearly half of which was from new entrants. Growth in cement consumption slowed around the same time commodity prices collapsed (2014-2016), exacerbated by delays in government funding for infrastructure projects. To stimulate consumption and in response to competition from new entrants, Semen Indonesia began lowering prices in 2015. With falling prices and utilization and a depreciating rupee, profitability across the industry collapsed. Semen Indonesia’s operating margin fell from ~29% in 2013 to ~12% in 2017; Indocement’s operating margin fell from ~32% to ~13%; and Holcim Indonesia’s operating margin fell from ~20% to slightly below zero. A similar trend probably occurred at every producer in the industry. As additional capacity continued to be built and demand growth remained modest, industry utilization fell to the low-60% range pre-covid and then to the mid-50% range post-covid. Industry consolidation began with Semen Indonesia’s acquisition of Holcim Indonesia’s (#3 player) in 2019. Indocement has made two deals in the last couple of years: leasing a 3.5m ton integrated cement plant from Bosowa for 3 years in 2022 and acquiring Semen Grobogan (2.7m tons of integrated capacity) in late 2023. Indonesia’s government implemented a moratorium on the construction of new cement plants in 2020, given the capacity situation. The moratorium is supposed to remain in place until capacity utilization reaches 85%. The image below shows the change in industry capacity, consumption, and utilization since the mid-1990’s.
Indonesia has six regions: Java, Sumatra, Sulawesi, Kalimantan, Nusa Tenggara and East Indonesia. The table below shows the population, integrated cement capacity, and cement demand in each region. Java is the most populous island and consumes the most cement. However, it also has the most integrated cement capacity and the lowest local demand as a percentage of that capacity (43%). This does not necessarily mean Java has the lowest capacity utilization, given that volume can be shipped to other regions, but it does imply that competition is probably greater in Java than in other regions. Integrated cement capacity in Java has increased by nearly 20m tons since 2017, the majority of which is from new entrants (some Chinese players and some local players).

Indocement’s Competitive Position: Indocement has three cement factories in Java, one in South Kalimantan, and one in Sulawesi (leased); ~80% of its capacity is in Java and >70% is specifically in West Java. Java has six regions: Jakarta, Banten, West Java, Central Java, Yogyakarta, and East Java. These regions are shown in the map below, with the location of Indocement’s cement capacity noted as well.

Indocement’s Citeureup Factory is the largest cement factory in Indonesia with ~19m tons of integrated capacity. The factory’s size and location make it the lowest cost supplier of cement to a significant portion of the western part of the island. (Jakarta (~20km from the Citeureup Factory) is the most densely populated region on the island and Bekasi (~40km), and Bogor (~20km) are the #1 and #3 most populous cities in West Java.) Indocement’s Palimanan Plant has 3.5m-4.0m tons of integrated capacity and is located near the border of West Java and Central Java. Historically, this plant supplied both regions, but a portion of that supply will be now diverted to other markets given the acquisition of Semen Grobogan. The Grobogan Plant has 2.7m tons of integrated capacity. It is in Central Java, ~30km from the coastal city Semarang and ~75km from Surakarta, the two most populous cities in the region.
Indocement’s strongest markets are on the western side of the island: Jakarta, Banten and West Java. It refers to these markets as its “home market.” INTP has over 45% market share (by volume) in each of these markets, a level it has maintained for years, and ~50% for the three regions combined. With the acquisition of Semen Grobogan, INTP also has over 40% market share in Central Java. The table below shows INTP’s market share by Java region for 2024.

Indocement has a significant cost advantage over other producers looking to sell in its home market for two main reasons: 1) the scale and location of the Citeureup Factory and 2) the advantages its local market share provides to distribution. Some of Indocement’s distribution is done by external parties but given its high market share and broad customer base these distributors typically only distribute Indocement products. Distributors for Indocement should have denser routes and higher turnover than distributors for other producers, allowing Indocement to pay a lower distribution fee per unit. Indocement has consistently earned a higher margin than all the other public cement producers in Indonesia. Semen Indonesia has greater market share nationally than Indocement, but its areas of strength are not as densely populated as Jakarta and West Java.
In 2024, Indocement sold 18.9m tons of cement domestically: 12.3m in Java, 1.9m in Sumatra, 1.8m in Nusa Tenggara, 1.3m in Kalimantan, 1.1m in Sulawesi, and 0.5m in East Indonesia. Java represented ~69% of Indocement’s revenue through the first nine months of 2024, with ~31% came from the other regions of Indonesia.
Indocement: utilization has roughly tracked the industry: low in the early 2000’s, picked up around ’06-’07, remained high through 2015 and subsequently declined to <60% in 2023. The tight industry supply and strong demand growth after 2007 allowed Indocement to consistently raise prices and leverage its fixed costs. Indocement’s USD EBITDA per ton averaged ~$31 between 2007 and 2014 (peak of ~$39 in 2012), up from ~$15 per ton in the early 2000’s. As utilization and average selling prices fell each year from 2015 to 2017, Indocement’s USD EBITDA per ton hit $9 in 2018. It rebounded in 2019 to $12 and has remained around that level since, despite utilization continuing to decline.
Indocement’s country wide market share slowly declined from a peak of ~32% in 2012 to ~25% in 2017. It has remained around 25% ever since. The lost market share was all outside of Indocement’s home market, where its aggregate market share increased from ~46% in 2014 to ~50% in 2024. Indocement lost market share in Central Java—which it regained and more with the acquisition of Semen Grobogan—East Java, and Kalimantan. Its volume in these latter two regions has remained flat over the last decade. Indocement’s ability to sustain its market share in its home markets while remaining firmly profitable is a testament to the strength of its position in these markets. Indocement’s business quality is medium: it has a very strong competitive position in a tough industry.
Capital Allocation + Management Quality: After years of deleveraging, following the Asian Financial Crisis, Indocement began paying dividends and increasing internal investment in the mid-2000s. The dividend payout ratio steadily rose over the years, exceeding 100% every year from 2017 to 2021. In late 2021, INTP began repurchasing shares for the first time. It spent Rp$2.7t repurchasing 6.8% of the shares outstanding from December 2021 to June 2022. Shareholder returns were significantly reduced in 2023, preceding a Rp$5.4t acquisition (EV) in December. The share repurchases were resumed in 2024. Management is high quality: capital allocation has been countercyclical, with the sole acquisition done at a low point in the cement cycle and share repurchases started when the share price was at historic lows (on absolute and relative valuation metrics).
The acquisition of PT Semen Grobogan was completed on December 1, 2023. INTP paid $97m and assumed $260m of debt, equivalent to 6-8x EBITDA and ~$132/ton of cement capacity. Grobogan has one integrated cement plant with ~2.7mt tons of capacity in Central Java, and a limestone quarry nearby with >50 years of reserves and resources. The plant is brand new, beginning operations in January 2022, and is well placed logistically to serve key markets in the area. Grobogan is a strong strategic fit for INTP’s core assets in West Java. Some of the volume being shipped from the Cirebon plant, which was running at capacity, can now be redirected to other markets. INTP and Grobogan collectively had ~44% market share in Central Java through the first nine months of 2023. The price paid is also attractive considering the strategic fit and the newness of the asset.
Board of Commissioners & Board of Directors: The corporate structure in Indonesia is slightly different than in most other countries. Each company is required to have a Board of Commissioners (BOC) that oversees the Board of Directors (BOD). The BOC is led by a President Commissioner and the BOD is headed by the President Director. The President Commissioner is akin to a Chairman and the President Director is comparable to a CEO. Indocement does not clearly disclose c-suite executive positions.
Kevin Gerard Gluskie was elected President Commission in May 2017. He previously served as CEO of Hanson Australia from 2009 to 2016. Hanson was acquired by Heidelberg Materials in 2007. Gluskie is also a member of the Managing Board-APAC of Heidelberg Materials for Asia Pacific regions.
Christian Kartawijaya was elected President Director in May 2014 after serving as the Director of Finance from 2004 to 2011.
Members of Heidelberg Materials’ managing board are on Indocement’s Board of Commissioners, including HEI’s CFO (who was appointed CFO in 2021).
Balance Sheet Quality (2024 Q3): Indocement has Rp$2.7 trillion in cash and Rp$2.0 trillion in debt. The debt was used to finance the acquisition of Semen Grobogan. INTP has a high quality balance sheet, something it has maintained since the early 2000’s.
Disclosure: I usually own shares, at the time of writing, of companies discussed on this blog. I write articles myself, expressing my own opinions. I have no business relationship with any company mentioned on this blog. There are no plans to provide updates on my buying or selling activities for each stock. I may buy or sell shares of the companies discussed on this blog without notice for any reason at any time.
Disclaimer: All information on this site is for informational purposes only. I make no representations as to the accuracy, completeness, suitability, or validity of any information. I will not be liable for any errors, omissions, or any losses, injuries, or damages arising from its display or use. Because the information is based on my opinion and experience, it should not be considered professional financial investment advice. These ideas should never be used without first assessing your own personal and financial situation, or without consulting a financial professional. My thoughts and opinions will change from time to time as I learn and accumulate more information. I am under no obligation to publically update my thoughts and opinions.
Thanks for this very detailled analysis. I am very impressed by the quality of all the details shared here.
There is no doubt IDX is quality company with dominant market share and profitability in their core region !
Cement market can be highly cyclical over the long term mainly depending on capacity addition .. but overall, this is a good business with strong local moat.
The fact that Indonesia has set a "moratorium on the construction of new cement plants ... supposed to remain in place until capacity utilization reaches 85%." is truly gamer changer for the producers. Considering the 64% capacity utilisation and the 2% increase in capacity per year, this should pave the way for 10 years with growing profitability for the producers !
This reminds me Egypt where over capacity crushed profitability from 2015-2022 .. but profitability has since recovered sharply following an production cap agreementbetween all the producers.
after reviewing, I d have some questions / observation :
1. what is the reason of the sudden share price drop in january 2025 ? anything related to local politics ?
2. What is the withholding tax on dividend in Indonesia ?
3. it is quite surprising Grobogan cement plant was constructed in 2022 while there was the moratorium. It should be the last cement plant authrorised before the restrictions ?!
4. INTP has accelerated the buyback .. which would reduce quickly the float... with a full buyout of remaining minority shareholders would be a logic endgame.
What'd be the protection on minority shareholder in Indonesia ?
Is there a specific treshold to prevent majority shareholder to force buyout ? (in some countries, this is 90% - 95%)